Slope in surplus production MP
SPslope.RdA management procedure that makes incremental adjustments to TAC recommendations based on the apparent trend in recent surplus production. Based on the theory of Mark Maunder (IATTC)
Arguments
- x
A position in the data object
- Data
A data object
- reps
The number of stochastic samples of the MP recommendation(s)
- plot
Logical. Show the plot?
- yrsmth
Years over which to smooth recent estimates of surplus production
- alp
Condition for modifying the Data (bounds on change in abundance)
- bet
Limits for how much the Data can change among years
Value
An object of class Rec-class with the TAC slot populated with a numeric vector of length reps
Details
Note that this isn't exactly what Mark has previously suggested and is stochastic in this implementation.
The TAC is calculated as:
$$\textrm{TAC}_y =
\left\{\begin{array}{ll}
M \bar{C} & \textrm{if } r < \alpha_1 \\
\bar{C} & \textrm{if } \alpha_1 < r < \alpha_2 \\
\textrm{bet}_2 \textrm{SP} & \textrm{if } r > \alpha_2 \\
\end{array}\right.
$$
where \(r\) is the ratio of predicted biomass in next year to biomass in
current year \(\bar{C}\) is the mean catch over the last yrmsth years, \(\alpha_1\)
and \(\alpha_2\) are specified in alp, \(\textrm{bet}_1\) and \(\textrm{bet}_2\)
are specified in bet, \(\textrm{SP}\) is estimated surplus production in most recent year,
and:
$$M = 1-\textrm{bet}_1 \frac{B_y - \tilde{B}_y}{B_y}$$
where \(B_y\) is the most recent estimate of biomass and \(\tilde{B}\)
is the predicted biomass in the next year.
Rendered Equations
See Online Documentation for correctly rendered equations
References
http://www.iattc.org/Meetings/Meetings2014/MAYSAC/PDFs/SAC-05-10b-Management-Strategy-Evaluation.pdf
See also
Other Surplus production MPs:
Fadapt(),
Rcontrol(),
SPMSY(),
SPSRA(),
SPmod()
Examples
SPslope(1, Data=MSEtool::Atlantic_mackerel, plot=TRUE)
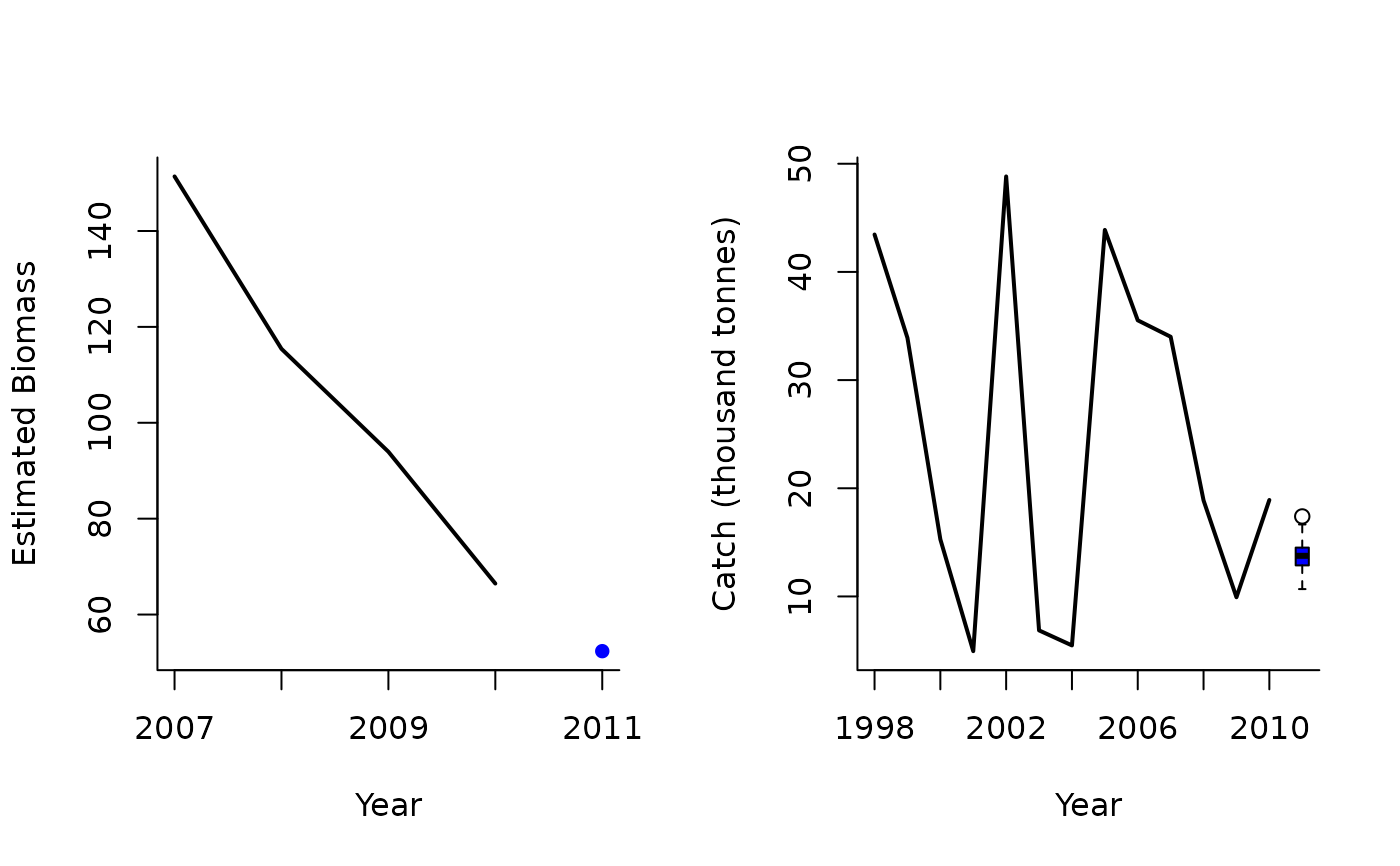 #> TAC (median)
#> 13.75607
#> TAC (median)
#> 13.75607