Surplus production based catch-limit modifier
SPmod.RdAn MP that makes incremental adjustments to TAC recommendations based on the apparent trend in surplus production. Based on the theory of Mark Maunder (IATTC)
Value
An object of class Rec-class with the TAC slot populated with a numeric vector of length reps
A numeric vector of TAC recommendations
Details
Note that this isn't exactly what Mark has previously suggested and is stochastic in this implementation.
The TAC is calculated as:
$$\textrm{TAC}_y =
\left\{\begin{array}{ll}
C_{y-1} \textrm{bet}_1 & \textrm{if } r < \alpha_1 \\
C_{y-1} & \textrm{if } \alpha_1 < r < \alpha_2 \\
\textrm{bet}_2 (b_2 - b_1 + C_{y-2} ) & \textrm{if } r > \alpha_2 \\
\end{array}\right.
$$
where \(\textrm{bet}_1\) and \(\textrm{bet}_2\) are elements in bet,
\(r\) is the ratio of the index in the most recent two years, \(C_{y-1}\)
is catch in the previous year, \(b_1\) and \(b_2\) are ratio of index
in \(y-2\) and \(y-1\) over the estimate of catchability \(\left(\frac{I}{A}\right)\),
and \(\alpha_1\), \(\alpha_2\), and \(\alpha_3\) are specified in argument
alp.
Rendered Equations
See Online Documentation for correctly rendered equations
References
http://www.iattc.org/Meetings/Meetings2014/MAYSAC/PDFs/SAC-05-10b-Management-Strategy-Evaluation.pdf
See also
Other Surplus production MPs:
Fadapt(),
Rcontrol(),
SPMSY(),
SPSRA(),
SPslope()
Examples
SPmod(1, Data=MSEtool::Atlantic_mackerel, plot=TRUE)
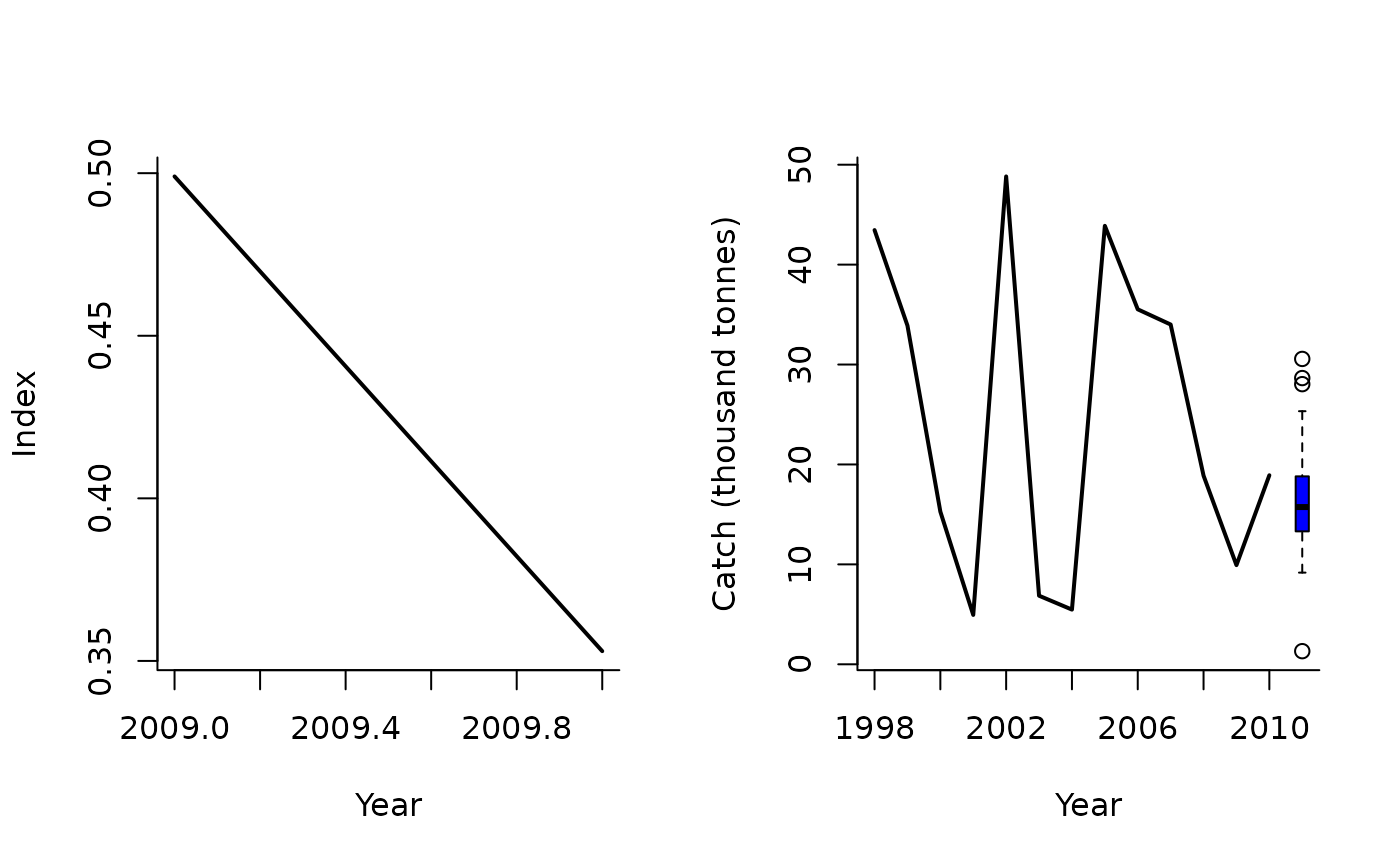 #> TAC (median)
#> 15.73564
#> TAC (median)
#> 15.73564