Mean length-based indicator MP of Jardim et al. 2015
Lratio_BHI.RdThe TAC is calculated as the most recent catch, modified by the ratio alpha, where the numerator is the mean length of the catch (of lengths larger than Lc) and the denominator is the mean length expected at MSY. Here, Lc is the length at full selection (LFS).
Usage
Lratio_BHI(x, Data, reps = 100, plot = FALSE, yrsmth = 3)

Lratio_BHI2(x, Data, reps = 100, plot = FALSE, yrsmth = 3)

Lratio_BHI3(x, Data, reps = 100, plot = FALSE, yrsmth = 3)Value
An object of class Rec-class with the TAC slot populated with a numeric vector of length reps
Details
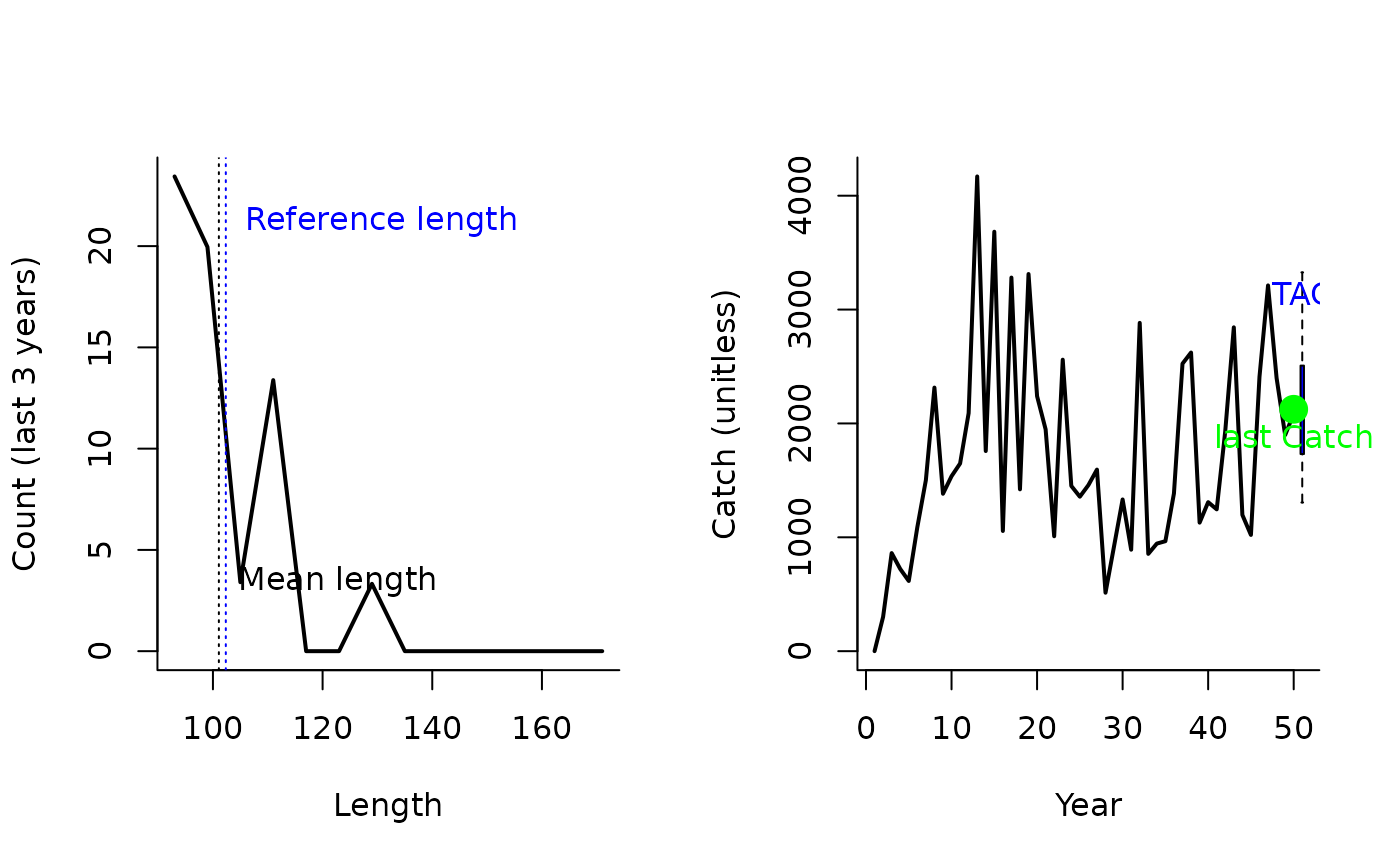
The TAC is calculated as:
$$\textrm{TAC}_y = C_{y-1} \frac{L}{L_\textrm{ref}}$$
where \(C_{y-1}\) is the catch from the previous year, \(L\) is the mean
length of the catch over the last yrsmth years (of lengths larger than Lc) and \(L_\textrm{ref}\) is the
mean length expected at MSY. Here, Lc is the length at full selection (LFS).
Functions
Lratio_BHI(): Assumes M/K = 1.5 and FMSY/M = 1. Natural mortality M and von Bertalanffy K are not used in this MP (see Appendix A of Jardim et al. 2015).Lratio_BHI2(): More general version that calculates the reference mean length as a function of M, K, and presumed FMSY/M.Lratio_BHI3(): A modified version of Lratio_BHI2 where mean length is calculated for lengths > modal length (Lc)
Required Data
See Data-class for information on the Data object
Lratio_BHI: CAL, CAL_bins, Cat, LFS, vbLinf
Lratio_BHI2: CAL, CAL_bins, Cat, FMSY_M, LFS, Mort, vbK, vbLinf
Lratio_BHI3: CAL, CAL_bins, Cat, FMSY_M, LFS, Mort, vbK, vbLinf
Rendered Equations
See Online Documentation for correctly rendered equations
References
Ernesto Jardim, Manuela Azevedo, Nuno M. Brites, Harvest control rules for data limited stocks using length-based reference points and survey biomass indices, Fisheries Research, Volume 171, November 2015, Pages 12-19, ISSN 0165-7836, https://doi.org/10.1016/j.fishres.2014.11.013
See also
Other Length target MPs:
Ltarget1(),
LtargetE1()
Examples
Lratio_BHI(1, Data=MSEtool::SimulatedData, plot=TRUE)
 #> TAC (median)
#> 1404.026
Lratio_BHI2(1, Data=MSEtool::SimulatedData, plot=TRUE)
#> TAC (median)
#> 1404.026
Lratio_BHI2(1, Data=MSEtool::SimulatedData, plot=TRUE)
 #> TAC (median)
#> 1464.231
Lratio_BHI3(1, Data=MSEtool::SimulatedData, plot=TRUE)
#> TAC (median)
#> 1464.231
Lratio_BHI3(1, Data=MSEtool::SimulatedData, plot=TRUE)
 #> TAC (median)
#> 2154.358
#> TAC (median)
#> 2154.358